Improving Learning with Data: Our Impact Dashboard
The Process of Learning Matters
Many educational institutions encourage student learning to be measured by grades received. At Opportunity Education and in the Quest Forward Academies, we believe that the process of how students learn, and the skills they acquire in that process, are at least as important.
By helping young people gain process skills for their learning, and by attending to the process of learning itself, we empower students to produce better outcomes for the rest of their lives, while also positioning them to produce better work while in school — something that does not happen when students are just aiming for a grade.
Grades are easy to measure and tabulate. But how do you measure process quality?
How We Measure the Quality of the Process
In our work at Opportunity Education and the Quest Forward Academies, we collect a wide variety of process-related data from the work of teachers and students: classroom engagement, effort, timeliness, support, learning progression, skills progression, volume of work, quality of work, consistency, and variability.
While highly valuable for supporting growth on a day-to-day basis, these reports are also powerful to help make informed longer-term decisions, such as informing our approach to Seamless Learning for the fall and beyond.
The Impact Dashboard automates the collection and display of these data into 6 sets of dashboards. Collectively, they provide clear indicators of how work is being done by students and mentors, whether students are learning and gaining skills, and whether students are showing positive growth trends for learning performance and skills. Mentor work volume and work process variables are included to provide insight into how mentors are contributing to student performance.
Improving Student Outcomes
The Impact Dashboard allows our mentor teachers to focus their attention where it will do students the most good. It also makes possible data-driven decisions about school operations.
An example: When the Quest Forward Academies decided to close their physical campuses and move instruction online at the end of Term 3 (January–March), we were concerned over whether the learning that happened during Term 4 (April–June) would be comparable. By looking at impact data we were able to see that this was indeed the case.
Not only were students just as engaged and just as productive in their work, that the quality and timeliness of that work was also inline with what it had been before the move online, as was overall student progression through the courses.
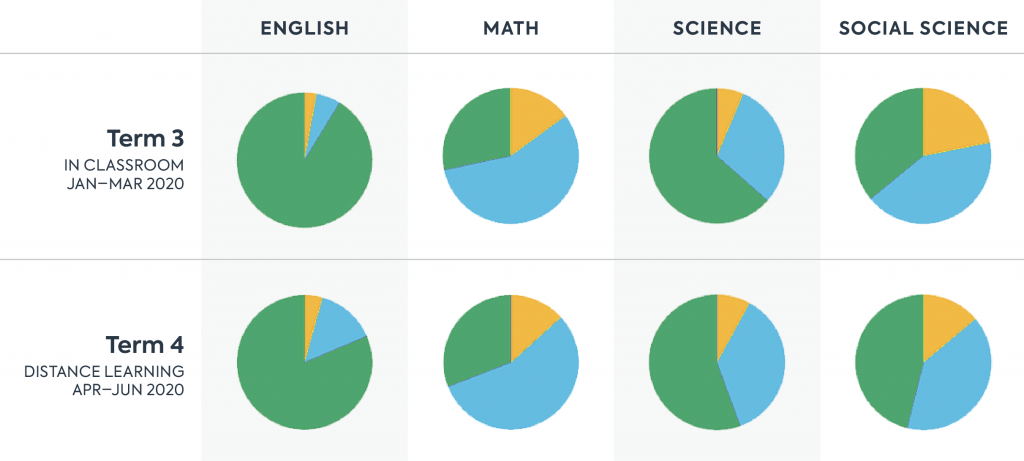
The following chart shows for one of the Academies what learning looked like during Terms 3 and 4, respectively, in each of the four core subjects.

Green: % of Students Exceeding Expectations
Blue: % of Students on Track
Yellow: % of Students Developing Understanding
The number of students exceeding expectations fell slightly in English and Science, but in both cases there was also a reduction in the number of students who were developing. Social Sciences saw an increase in the number exceeding expectations and a corresponding reduction in the number who were developing. Mathematics remains effectively constant. Overall, very little difference was seen between the performance in class and online.
This observation is what let the Academies move forward in confidence with the plans for Seamless Learning for the 2020-21 school year.
This is just one example of the Impact Dashboard. In later blog posts I will show other versions of the dashboard, explain how it is incorporated into the instructional practice and the types of improvements we are seeing as a result.
By collecting the data, visualizing the data, and using the data to improve the process of learning, this is how we will ultimately improve the outcomes for our students.
